Educational resources provided to assist advanced futures traders improve their futures trading techniques and styles. Use the navigation panel on the right to jump to any pattern. Questions? Call us at (800) 454-9572 U.S. or (310) 859-9572 International.
Recognize, understand, and apply these patterns in your commodities trading strategies. See Page Two for additional patterns.
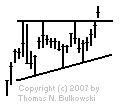
An ascending triangle is a bullish futures pattern that can indicate a breakout in the upwards direction.
An ascending triangle is formed when resistance remains flat and support rises.
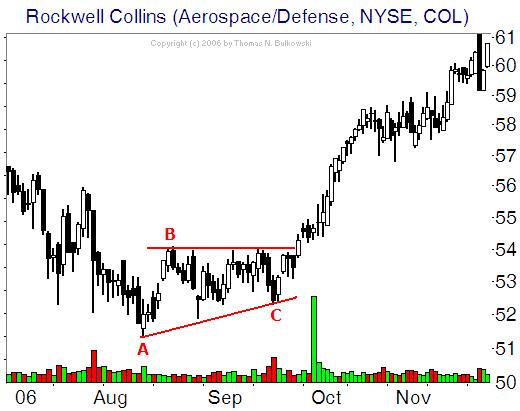
The price will rise and fall within the triangle until support and resistance converge. At that point, the apex, breakout occurs, usually upwards.
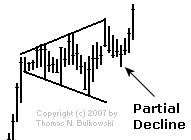
A broadening top is a futures chart pattern that can occur on an upwards trend. It is generally classified as a reversal pattern but some traders argue that there is approximately a 50/50 split between whether it tends to move upwards or downwards upon completion of the pattern. For this reason, it can often be avoided by traders. It can be viewed as the opposite of a symmetrical triangle.
A broadening top is comprised of diverging support and resistance lines and resembles a megaphone. The rising resistance line and falling support line continue until the trend reverses.
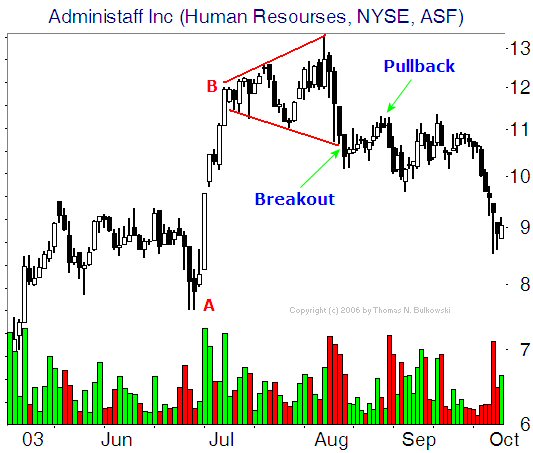
This is a less common futures chart pattern pointing to a highly unstable market. As support drops and resistance rises, volatility increases.
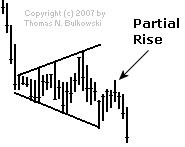
A broadening bottom is a chart pattern that can occur on a downward trend. It is generally classified as a reversal pattern but some traders argue that there is approximately a 50/50 split between whether it tends to move upwards or downwards upon completion of the pattern. For this reason, it can often be avoided by traders. It can be viewed as the opposite of a symmetrical triangle.
A broadening bottom is comprised of diverging support and resistance lines and resembles a megaphone. The rising resistance line and falling support line continue until the trend reverses.
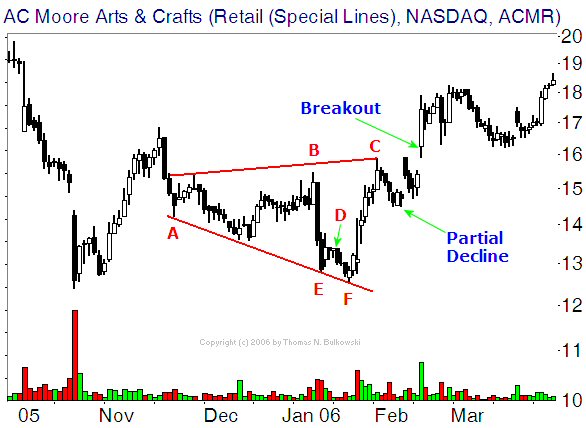
This is a less common futures trading chart pattern pointing to a highly unstable market. As support drops and resistance rises, volatility increases.
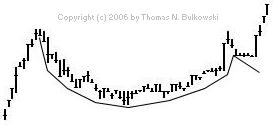
A cup and handle is a bullish continuation pattern which can mark a pause in an up-trend before it continues.
A cup and handle is formed as follows:
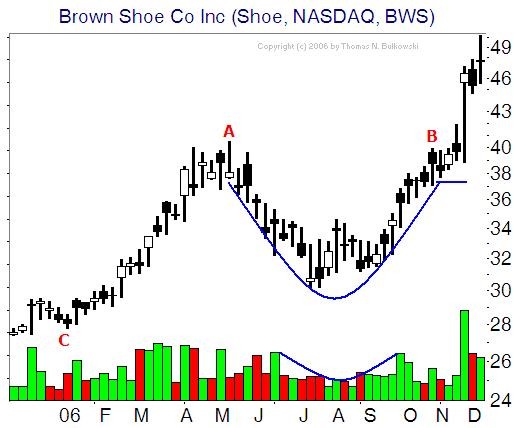
Resistance is tested in a unique way in this pattern, and it can be helpful to watch how the handle is formed. One possible rule of thumb is that the handle can comprise about one third of the movement of the cup portion of the pattern.
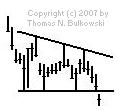
A descending triangle is a bearish pattern that can indicate an impending downward trend.
A descending triangle is formed when support remains flat as resistance drops.
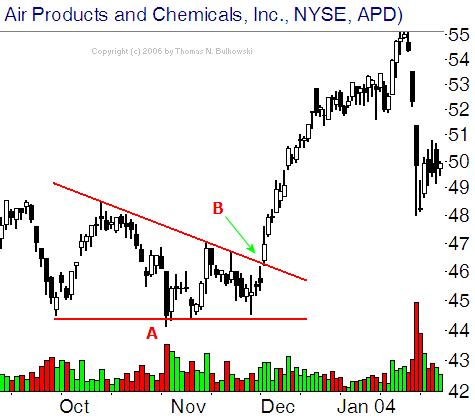
The price will rise and fall within the triangle until support and resistance converge. At that point, the apex, breakout occurs, usually downwards. Note that in the above example, the price moves upwards on completion of the pattern. This is not as common but it is important to be aware of all the potential movements when using chart patterns.
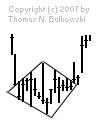
A diamond bottom is a bullish reversal pattern that can mark the beginning of an upward trend.
A diamond bottom is formed when a price trend begins to widen and then narrows.
First, identify an off-center head and shoulders pattern. Then, draw support and resistance trendlines. The ensuing shape closely resembles a diamond.
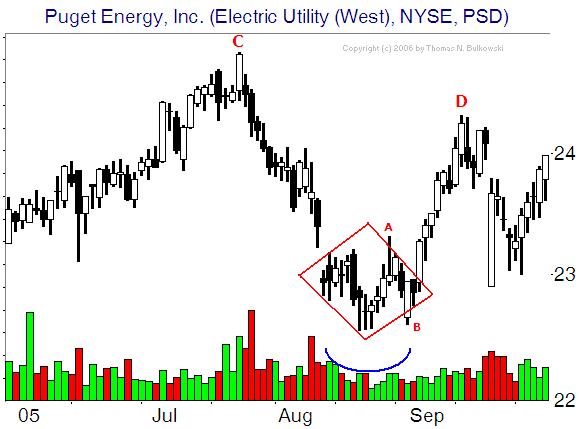
Since it is a bullish reversal pattern, a diamond bottom can indicate that a steady downtrend is about to reverse and one could long the market.
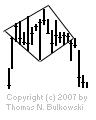
A Diamond Top is a bearish reversal pattern that can mark the beginning of a downward trend.
A diamond top is formed when a price trend begins to widen and then narrows.
First, identify an off-center head and shoulders pattern. Then, draw support and resistance trendlines. The ensuing shape closely resembles a diamond.
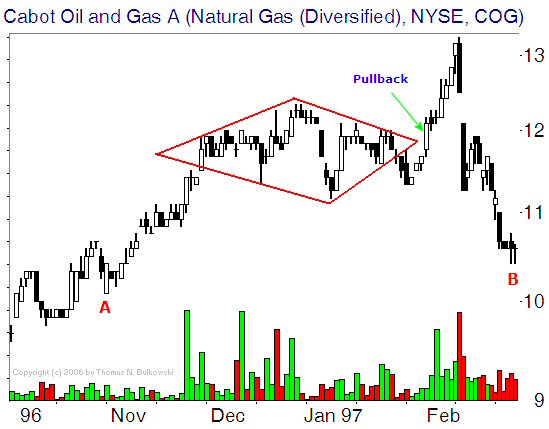
Since it is a bearish reversal pattern, a diamond top can indicate that a steady uptrend is about to reverse and one could short the market.
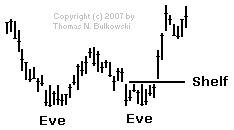
A Double Bottom is a reversal pattern that occurs at the peak (eve on the chart to the right) of a downward trend and can mark the beginning of an upward trend.
A double bottom chart pattern occurs in four stages:
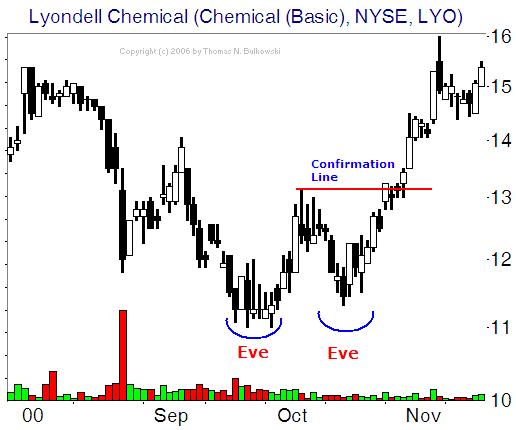
A double bottom chart pattern can point to a tug of war between buyers and sellers. While sellers try to push the contract, buyers resist the downward trend. When once again the bottom of the pattern isn't broken, the sellers begin to back off, leading the buyers to dominate and send the trend upward.
Watch the new upward trend, as it may drop back down to the breakout point to test the new support.
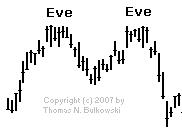
A double top is a reversal pattern that occurs at the peak (eve on the chart to the right) of an upward trend and can mark the beginning of a downward trend.
A double top chart pattern occurs in four stages:
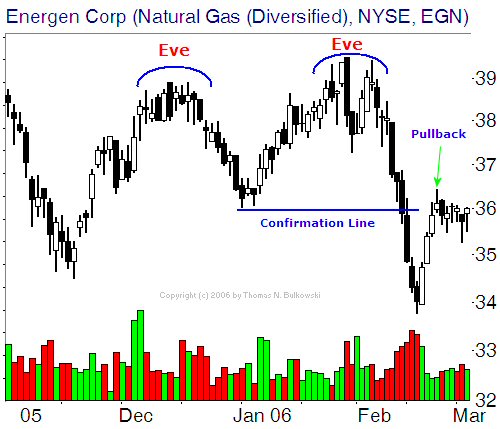
A double top chart pattern can point to a tug of war between buyers and sellers. While buyers try to push the contract, sellers resist the upward trend. When once again the top of the pattern isn't broken, the buyers begin to back off, leading the sellers to dominate and send the trend downward.
Watch volume in this scenario, as it is likely to increase once the contract is below support. This support level may now become a new resistance level in the new trend.
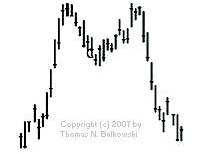
Note that a similar chart pattern is the Big M, which has all the principles of a Double Top, but with much steeper moves. The Big M is displayed to the right.
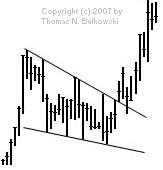
A falling wedge is a bullish reversal pattern. It can indicate that a downtrend in an upward moving market is about to end.
As the price in a bull market moves down, the distance between highs and lows grows smaller and smaller, until support and resistance converge and the price makes an upturn.
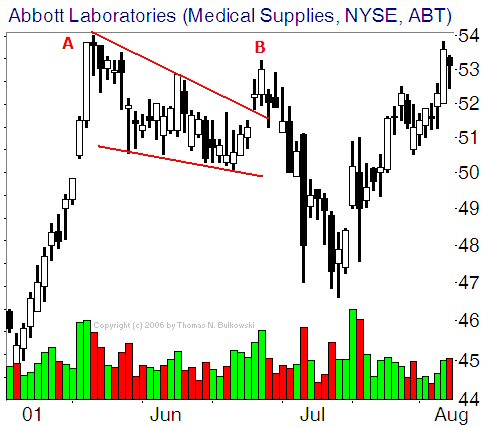
To be sure that this is indeed a falling wedge and a reversal is about to happen, watch volume, as it should be increasing.
Trading commodity futures and options involves substantial risk of loss. The recommendations contained are of opinion only and do not guarantee any profits. These are risky markets and only risk capital should be used. Past performances are not necessarily indicative of future results. This is not a solicitation of any order to buy or sell, but a current futures market view. Any statement of facts herein contained are derived from sources believed to be reliable, but are not guaranteed as to accuracy, nor they purport to be complete. No responsibility is assumed with respect to any such statement or with respect to any expression of opinion herein contained. Readers are urged to exercise their own judgment in trading!
Open a live futures account and start trading with competitive commissions, a free platform, and direct broker support. Or try a no-obligation free demo today.