


Advanced Futures Trading
Educational resources provided to assist advanced futures traders improve their commodities trading techniques and styles
Use the navigation panel to the right to jump ahead to a particular section. If you have any questions after reading this commodities trading educational material, or about anything included in here, don't hesitate to call us at (800) 454-9572 U.S. or (310) 859-9572 International. You can also go back to Page One of the chart patterns advanced futures trader educational material.
Flag Futures Trading Chart Pattern
What is a Flag Futures Chart Pattern?
 A flag chart pattern is a continuation pattern resembling a parallelogram formed by two trendlines marking support and resistance. After a large price movement, the market can slow down before resuming that trend.
How Do I Recognize a Flag Futures Chart Pattern?
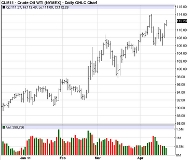
Usually, a flag occurs on an upwards or downwards slope. The pattern is complete when the price breaks out. The flag also tends to be in the opposite direction of an initial price movement. Also note the flagpole, which marks the first sharp movement to the last sharp movement.
See the example below:

What Does a Flag Chart Pattern Mean?
Once the contract price breaks through support or resistance, a buy or sell signal is formed, usually on heavier volume.
Head and Shoulders Bottom Futures Trading Chart Pattern
What is a Head and Shoulders Bottom Futures Chart Pattern?
 A head and shoulders bottom is a reversal pattern which can indicate that a contract is about to move against the previous trend.
How Do I Recognize a Head and Shoulders Bottom Futures Chart Pattern?
A head and shoulders bottom pattern has three peaks -- two smaller ones on the sides and one larger one in the middle.
First, a contract falls to a new low and then rises back to a new high (the "neckline," which marks resistance). Then, the contract hits an even lower lower before rising back up to the previous right. The right shoulder is formed when the contract falls back down but not as low as the previous low, and then rises back up to the high. The pattern is complete when the price breaks through the previous high, or the neckline.
See the example below:

What Does a Head and Shoulders Bottom Chart Pattern Mean?
The head and shoulders bottom pattern can indicate that a new upward trend is about to happen. Watch volume, as breakouts will tend to occur on high-volume moves.
Head and Shoulders Top Futures Trading Chart Pattern
What is a Head and Shoulders Top Chart Pattern
 A head and shoulders top is a reversal pattern which can indicate that a contract is about to move against the previous trend.
How Do I Recognize a Head and Shoulders Top Futures Chart Pattern?
A head and shoulders top pattern has three peaks -- two smaller ones on the sides and one larger one in the middle.
First, a contract rises to a new high and then falls back to a new low (the "neckline," which marks support). Then, the contract hits an even higher high before dropping back down to the previous low. The right shoulder is formed when the contract rises back up but not as high as the previous high, and then falls back down to the low. The pattern is complete when the price breaks through the previous low, or the neckline.
See the example below:

What Does a Head and Shoulders Top Chart Pattern Mean?
The head and shoulders top pattern can indicate that a new downward trend is about to happen. Watch volume, as breakouts will tend to occur on high-volume moves.
Pennant Futures Trading Chart Pattern
What is a Pennant Futures Chart Pattern?
 A pennant chart pattern is a continuation pattern that forms when support and resistance trendlines converge. After a large price movement, the market can slow down before resuming that trend.
How Do I Recognize a Pennant Futures Chart Pattern?
Unlike triangles, support and resistance are not tested multiple times. They mark a sideways price movement after a period of sharp movement.
See the example below:

What Does a Pennant Chart Pattern Mean?
Once the contract price breaks through support or resistance, a buy or sell signal can be formed, usually on heavier volume.
Rectangle Bottom Futures Trading Chart Pattern
What is a Rectangle Bottom Futures Chart Pattern?
 A rectangle bottom is a chart pattern that starts on a downtrend and marks a period of consolidation before a breakout occurs.
How Do I Recognize a Rectangle Bottom Futures Chart Pattern?
A rectangle bottom is formed when a price bounces up and down between two parallel support and resistance lines.
See the example below:

What Does a Rectangle Bottom Chart Pattern Mean?
A rectangle bottom can break out in either direction. What can make it useful is that it can indicate that once support or resistance is finally broken, a new trend is established in that direction.
Rectangle Top Futures Trading Chart Pattern
What is a Rectangle Top Futures Chart Pattern?
 A rectangle top is a chart pattern starts on an uptrend marks a period of consolidation before a breakout occurs.
How Do I Recognize a Rectangle Top Futures Chart Pattern?
A rectangle top is formed when a price bounces up and down between two parallel support and resistance lines.
See the example below:

What Does a Rectangle Top Chart Pattern Mean?
A rectangle top can break out in either direction. What can make it useful is that it can indicate that once support or resistance is finally broken, a new trend is established in that direction.
Rising Wedge Futures Trading Chart Pattern
What is a Rising Wedge Futures Chart Pattern?
 A rising wedge is a bearish reversal pattern. It can indicate that an uptrend in a downward moving market is about to end.
How Do I Recognize a Rising Wedge Futures Chart Pattern?
As the price in a bear market moves up, the distance between highs and lows grows smaller and smaller, until support and resistance converge and the price makes a downturn.
See the example below:

What Does a Rising Wedge Chart Pattern Mean?
To be sure that this is indeed a rising wedge and a reversal is about to happen, watch volume, as it should be descreasing. Also, the retrace should be below 50% of the fibonnaci level.
Symmetrical Triangle Futures Trading Chart Pattern
What is a Symmetrical Triangle Futures Chart Pattern?
 A symmetrical triangle is a continuation pattern. It occurs during the consolidation of a trend and can indicate that the previous trend is about to continue.
How Do I Recognize a Symmetrical Triangle Futures Chart Pattern?
A symmetrical triangle is formed by a dropping resistance line and a rising support line.
See the example below:

What Does a Symmetrical Triangle Chart Pattern Mean?
The price will rise and fall within the triangle until support and resistance converge. At that point, the apex, breakout occurs, usually in the direction of the previous trend, but it can also move in the opposite direction.
Triple Bottom Futures Trading Chart Pattern
What is a Triple Bottom Futures Chart Pattern?
 A triple bottom is a bullish reversal pattern that can occur when a contract tests a level of support three times and then rises above resistance.
How Do I Recognize a Triple Bottom Futures Chart Pattern?
A triple bottom chart pattern occurs when:
- Price reaches a new high
- The trend tests support and rises back to resistance
- The price begins to move back to support, but rises to test resistance again
- The price begins to move back to support again, but yet rally occurs, meeting resistance
- The price finally breaks resistance and establishes a new upward trend
See the example below:

What Does a Triple Bottom Chart Pattern Mean?
A triple bottom chart pattern points to a tug of war between buyers and sellers. While sellers try to push the contract, buyers resist the downward trend. When once again the bottom of the pattern isn't broken, the sellers begin to back off, leading the buyers to dominate and send the trend upward.
Watch the new upward trend, as it may drop back down to the breakout point to test the new support.
Since this pattern is similar to the double bottom chart pattern, but sure to watch for when it breaks resistance. It is this move that ultimately signals the completion of the pattern. Otherwise, the contract may continue to bounce up and down between support and resistance.
Triple Top Futures Trading Chart Pattern
What is a Triple Top Futures Chart Pattern?
 A Triple top is a bearish reversal pattern that can occur when a contract tests a level of resistance three times, is unable to break through, and then falls below support.
How Do I Recognize a Triple Top Futures Chart Pattern?
A triple top chart pattern occurs when:
- Price reaches a new high
- The trend faces resistance and sells off to support
- The price begins to move back to resistance, but another sell off occurs, meeting support again
- The price begins to move back to resistance again, but yet another sell off occurs, meeting support
- The price falls below support, establishing a downward trend
See the example below:

What Does a Triple Top Chart Pattern Mean?
A triple top chart pattern points to a tug of war between buyers and sellers. While buyers try to push the contract, sellers resist the upward trend. When once again the top of the pattern isn't broken, The buyers begin to back off, leading the sellers to dominate and send the trend downward.
Watch volume in this scenario, as it is likely to increase once the contract is below support. This support level may now become a new resistance level in the new trend.
Since this pattern is similar to the double top chart pattern, but sure to watch for when it breaks support. It is this move that ultimately signals the completion of the pattern. Otherwise, the contract may continue to bounce up and down between support and resistance.
Go back to page one of the Chart Patterns Advanced Futures Trader educational material.
Trading commodity futures and options involves substantial risk of loss. The recommendations contained are of opinion only and do not guarantee any profits. These are risky markets and only risk capital should be used. Past performances are not necessarily indicative of future results. This is not a solicitation of any order to buy or sell, but a current futures market view. Any statement of facts herein contained are derived from sources believed to be reliable, but are not guaranteed as to accuracy, nor they purport to be complete. No responsibility is assumed with respect to any such statement or with respect to any expression of opinion herein contained. Readers are urged to exercise their own judgment in trading!